Boston Children's Museum
308 Congress Street, Boston, MA 02210
617-426-6500
© Boston Children’s Museum 2025
Website Design by JackrabbitThis simple activity introduces children to basic experiment design, recording, observation, animal behavior and some basic math skills like counting, addition and graphing results.
Gather all materials chosen in the brainstorm described below. Be certain that you already know of an area where pigeons congregate regularly. If you can’t find pigeons in your area, you can likely find other birds such as sparrows, starlings, seagulls, etc.

The day before conducting this activity, hold a brainstorming session with your children around these questions: What do you think pigeons LIKE to eat? What foods do you think pigeons DON’T LIKE to eat? When you have a sufficient list, ask them to choose 3–5 different foods from the “like” list, and 3–5 from the “don’t like” list that they might use to test their predictions. Try to have a variety of foods (ex. 6 different kinds of snack chip won’t yield very interesting results). Tell your kids that tomorrow, they’ll be testing these foods with real pigeons and recording the results.
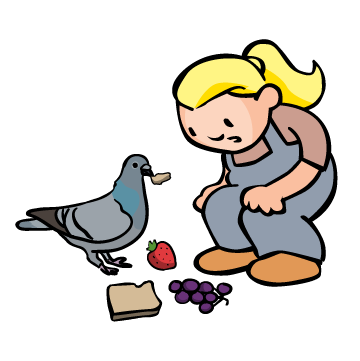
Can you design an experiment to discover what kinds of foods pigeons most like to eat?
When the experiment is done, bring your students together and have a discussion about the results. Were the initial predictions proven true? Did any results surprise them? What do the foods that the pigeons liked have in common? How are they different from the foods that the pigeons did not seem to like? What do those uneaten foods have in common?
Having tried this experiment once, ask your students if there are any other foods that they think the pigeons might be interested in. What did they learn in this first experiment that causes them to choose these other foods as ones they think the pigeons will like? Are the pigeons attracted to color, smell, shape, texture, etc.? How could you design an experiment to figure out the answer? If you are working with older children, you could also have them display the results of this experiment as bar graphs, pie charts, etc.
Once you have talked about the results, plan a second experiment to answer some of the questions discussed above.